🎯 Before We Begin — A Wake-up Call
Let me tell you something that every future doctor and public health professional must know:
👉 Numbers lie… unless you know how to read them.
You can look at two health reports, two death rates, or two hospital statistics —
and you might draw completely wrong conclusions if you don’t understand crude rates and standardization.
So before we dive into formulas, let’s start with a question.
💬 Imagine This:
Two districts send their annual health reports.
| District | Crude Death Rate (per 1,000) | Population Type |
|---|---|---|
| District A | 10 | Mostly young people |
| District B | 13 | Many elderly citizens |
Everyone in the meeting room points at District B:
“Their death rate is higher — their health system must be poor!”
But… is that true? 🤔
Let’s pause and think:
- District B has more elderly people — naturally, their risk of death is higher.
- District A has more young adults — naturally, their death rate is lower.
So the higher death rate doesn’t necessarily mean worse health care — it may just reflect the age structure.
And that realization right there is the key to understanding why we need standardization.

💡 Step One — Understand the Crude Death Rate
Before you even touch the word “standardization,” you must understand what a crude rate really tells you.
🧩 Crude Death Rate (CDR) =
Total deaths in a year ÷ Total population × 1,000
It’s called “crude” for a reason — because it’s raw, unrefined, and not adjusted for any factor.
It tells you what’s happening in the population as a whole, but not why it’s happening.
Think of it as looking at a cake from the outside — you see the icing, but you have no idea what’s inside.
⚖️ Step Two — The Hidden Problem with Crude Rates
Crude rates are influenced by the composition of the population —
especially by age, sex, and occupation.
Let’s take an example.
- A country with more old people will always show a higher death rate — even if healthcare is excellent.
- A country with more young people will naturally show a lower death rate — even if healthcare is poor.
So if you compare these countries using crude rates, you’re not comparing health —
you’re comparing age distributions.
💬 And that’s unfair, unscientific, and misleading.
🧠 Step Three — The Eye-Opener: Why Standardization Exists
Standardization was created because we realized something shocking in public health:
“Two populations may look different not because of their health, but because of their structure.”
So, to remove this bias, statisticians said —
“What if we assume both populations have the same age structure and then see how they perform?”
That’s it.
That’s the soul of standardization.
It’s not a math trick — it’s a fairness filter.
It allows you to compare two populations as if they were made up of the same kinds of people.
💬 In simpler words:
“We can’t change the people — but we can change the lens we look through.”
📊 Step Four — The Idea of a Standard Population
Now imagine this:
You want to compare two districts.
Both have different proportions of children, adults, and elderly.
So you create a standard population —
a model population with fixed proportions of age groups (for example, 30% children, 60% adults, 10% elderly).
Then you apply both districts’ age-specific death rates to this same standard structure.
Now, the only thing that differs is their true mortality risk, not their population makeup.
🎯 That’s fairness.
🎯 That’s accuracy.
🎯 That’s standardization.
🧮 Step Five — The Two Roads: Direct and Indirect Standardization
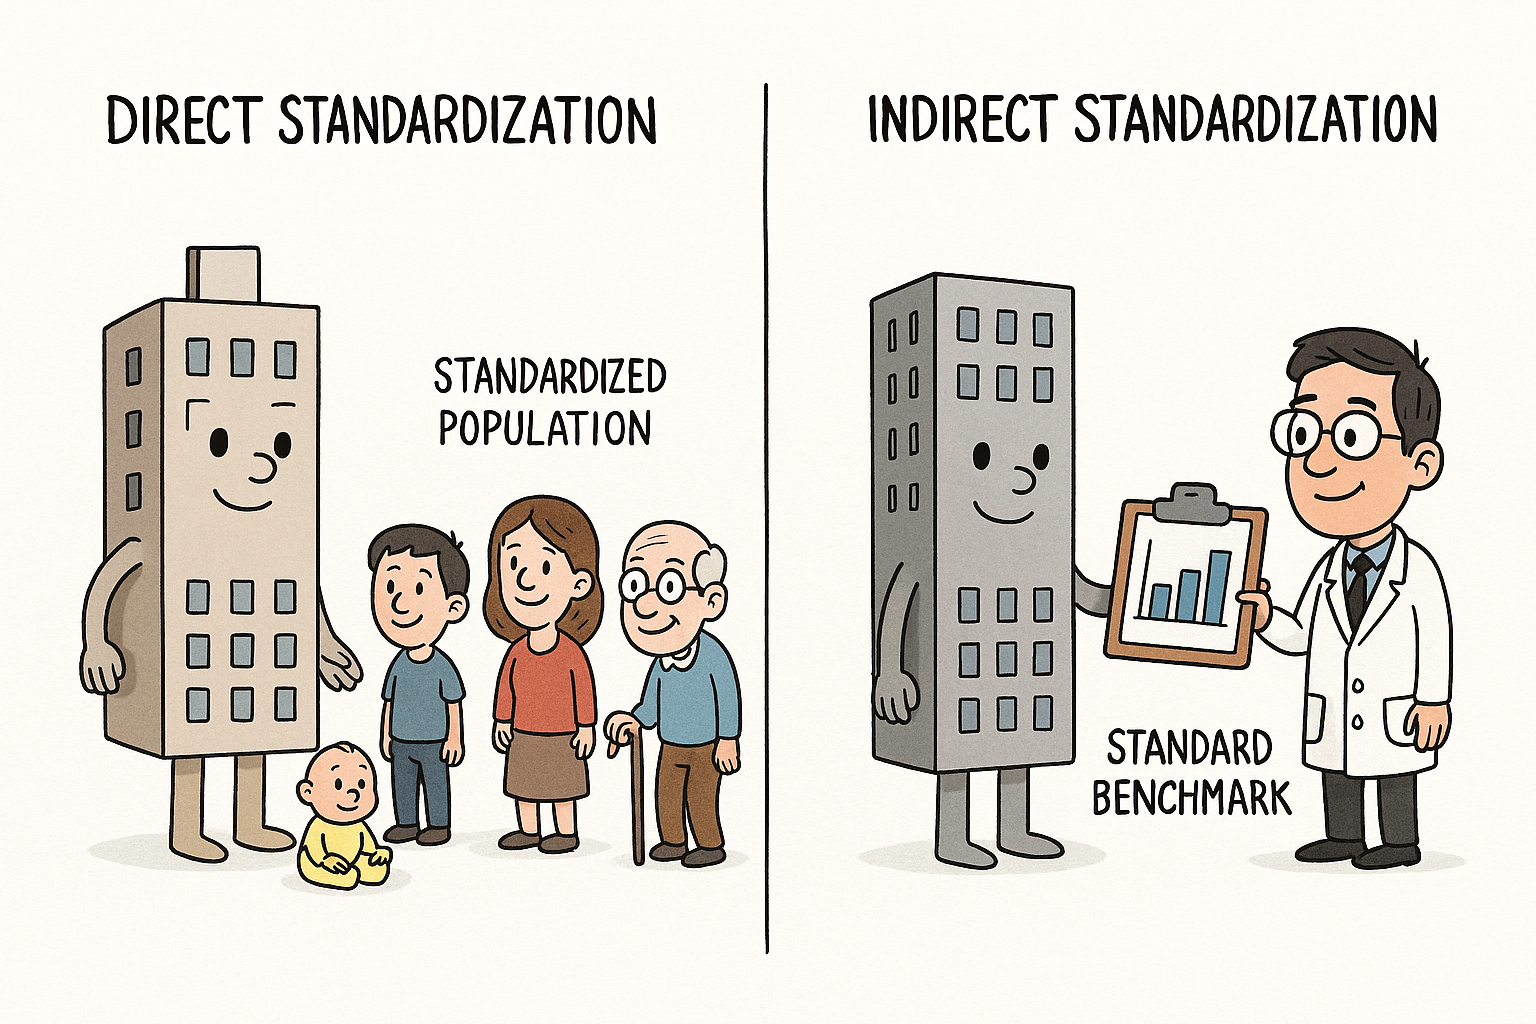
Once you understand why, the how becomes easy.
1️⃣ Direct Standardization
Used when you know each group’s specific rates.
- Apply them to a standard population.
- Calculate how many deaths would occur in that same structure.
- Get the standardized rate.
💬 It’s like comparing schools by giving them the same exam paper.
2️⃣ Indirect Standardization
Used when you don’t have detailed group data.
- Use the standard population’s rates.
- Apply them to your population to find expected deaths.
- Compare expected vs observed using SMR (Standardized Mortality Ratio).
💬 It’s like comparing your school’s performance against the national average.
⚗️ Step Six — See It in Action
Let’s bring our example back:
| Age Group | City A Death Rate | City B Death Rate | Standard Population |
|---|---|---|---|
| 0–14 years | 2 per 1000 | 3 per 1000 | 30,000 |
| 15–59 years | 6 per 1000 | 8 per 1000 | 60,000 |
| 60+ years | 40 per 1000 | 35 per 1000 | 10,000 |
When you apply both cities’ rates to the same standard population,
you might find that City B — which looked worse before — actually has a lower standardized death rate.
✅ City A = 9/1,000
✅ City B = 7/1,000
So now you know the truth: City B performs better once age is considered.
🧩 Step Seven — Why This Concept Is Worth Your Attention
Students often ask, “Sir, is this really important for MBBS?”
Yes — it’s foundational.
Here’s why 👇
- Without understanding crude rates, you can’t interpret a single epidemiological report.
- Without standardization, you’ll draw wrong policy conclusions.
- And without standard population, you’ll never know whether a district’s success is real — or just statistical illusion.
This is the difference between data and wisdom.
🩺 Step Eight — Application: A Real Case
The Government of India once wanted to award the district with the lowest death rate.
| District | Crude Death Rate | Elderly Population |
|---|---|---|
| District X | 11 | 25% |
| District Y | 8 | 10% |
The government almost awarded District Y.
But after age standardization, they found:
- District X = 7.4/1,000
- District Y = 8.3/1,000
✅ The real winner was District X.
They had more elderly people, but better healthcare — and standardization revealed it.
🧠 Step Nine — Reflect Before You Forget
Every time you read “death rate,” “disease rate,” or “case fatality rate,” ask yourself:
“Crude or standardized?”
That one question separates a true public health thinker from a number reader.
🌟 In Short
Crude rate tells you what’s happening.
Standardized rate tells you what it truly means.
And the Standard Population is the lens that makes your comparison fair, scientific, and meaningful.
💬 Let’s See How Much You Learnt
Question:
Two hospitals are being compared.
Hospital A has a higher crude death rate but serves mostly elderly patients.
Hospital B has a lower death rate but treats mostly young adults.
Which hospital is performing better — and how can you find out?
Answer:
✅ You can’t tell from crude rates alone.
You must use age standardization (direct or indirect) using a standard population to compare fairly.
💭 Final Words for My Students
“The numbers you see are not reality — they are reflections.
Standardization is the mirror that removes distortion and shows you the truth.”Let’s See How Much You Learnt — Standardization & Standard Population
Q1. (Basic Understanding)
Two cities — City A and City B — have the following crude death rates:
- City A: 8 per 1,000
- City B: 12 per 1,000
City B has a larger elderly population.
👉 Why can’t we directly say that City B is less healthy?💬 Hint: What factor affects crude rates?
Q2. (Concept Connection)
In simple words, what is the standard population used for in standardization?
Choose the correct answer:a) To find the total number of deaths.
b) To provide a common reference structure for fair comparison.
c) To replace missing data.
d) To make population larger.✅ Answer: b) To provide a common reference structure for fair comparison.
Q3. (Types of Standardization)
Fill in the blanks:
- In Direct Standardization, we apply the __________ rates of our study population to a __________ population.
- In Indirect Standardization, we apply the __________ rates to our __________ population.
✅ Answer:
- Direct: study rates → standard population
- Indirect: standard rates → study population
Q4. (Concept Application)
A small rural hospital doesn’t have detailed age-wise data but wants to compare its mortality with the national average.
👉 Which type of standardization should be used — direct or indirect — and why?✅ Answer:
Use indirect standardization, because the hospital lacks detailed age-specific data. The national (standard) rates can be applied to its population to calculate the Standardized Mortality Ratio (SMR) for comparison.
Q5. (Real-Life Application-Based Scenario)
The Government of India plans to reward the best-performing district health team based on death rates.
Here’s the data:
District Crude Death Rate (per 1000) Population Type District X 11 Large elderly population District Y 8 Mostly young population At first, District Y looks better — fewer deaths, right?
But the evaluation committee realized that District X has more elderly people, while District Y’s population is mostly young adults.So, instead of crude rates, they used age-standardized death rates, applying both districts’ age-specific rates to a standard population (like the national census structure).
After adjustment, results showed:
- District X’s standardized death rate: 7.5 per 1000
- District Y’s standardized death rate: 8.4 per 1000
✅ Final Decision:
The award was given to District X, because after standardization, it was found to have better true health outcomes — the earlier difference was only due to age composition.💬 Learning Point:
Standardization removes unfair differences due to population structure and helps identify the real performers in public health programs.
🌟 In Short
Question Type Concept Reinforced Q1 Why crude rates are misleading Q2 Role of standard population Q3 Direct vs. Indirect standardization Q4 When to use which method Q5 Real-world application — fair health comparison